
- Galleries
- AI-Generated Data Art
Data Art
Discover the beauty of data art. Browse unique, AI-generated visualizations and learn how data can be transformed into captivating visual experiences.

As seen in


AI-Generated Data Art
A curated collection of imaginative data art, showcasing the intersection of information and aesthetics through AI-powered creativity.


Didn't find what you were looking for? Create your own below!
Create your own Data Art images
Discover the magic of Text to Image AI by creating your own unique images. Edit the prompt below to customize your creation.
No payment or credit card required.

Transforming Data Into Art
Explore Stunning Data Art Creations
Dive into a world where raw data transcends its numerical form to become breathtaking works of art. Our AI generates unique visualizations that reveal hidden patterns and aesthetic qualities within datasets. Experience the fusion of science and creativity, perfect for adding a unique touch to any project or simply marveling at the beauty of information.
Create Your Own Data Art
Step 1
Describe Your Data Visualization
Begin by entering a detailed text prompt describing the type of data visualization you envision. Think about the data source (e.g., 'stock market trends', 'weather patterns', 'social media engagement'), the desired aesthetic (e.g., 'abstract', 'geometric', 'organic'), and any specific colors or moods you want to convey.
Step 2
Generate Your Visualization
After refining your prompt, click the 'Generate Visualization' button. Our AI will process your description and begin creating a unique data-driven artwork based on your specifications.
Step 3
Download & Share Your Art
Once your data art is ready, you can download it in high resolution to use in your projects or presentations. Feel free to share your creation with others and inspire them with the beauty of data transformed into art!

Unlock Creative Potential
Explore AI Data Visualization For Unique Creations
Leverage the power of AI Data Visualization to bring your most imaginative concepts to life. Our advanced models translate intricate information into compelling visual narratives, offering endless possibilities for unique artistic expressions. Whether for professional insights or personal projects, explore how data can become the foundation for truly one-of-a-kind digital art.
More Galleries

Magnolia Flower Drawings - AI Generated
Explore stunning AI-generated magnolia flower drawings. Find inspiration for your own floral art or create unique magnolia illustrations with our advanced AI tools.
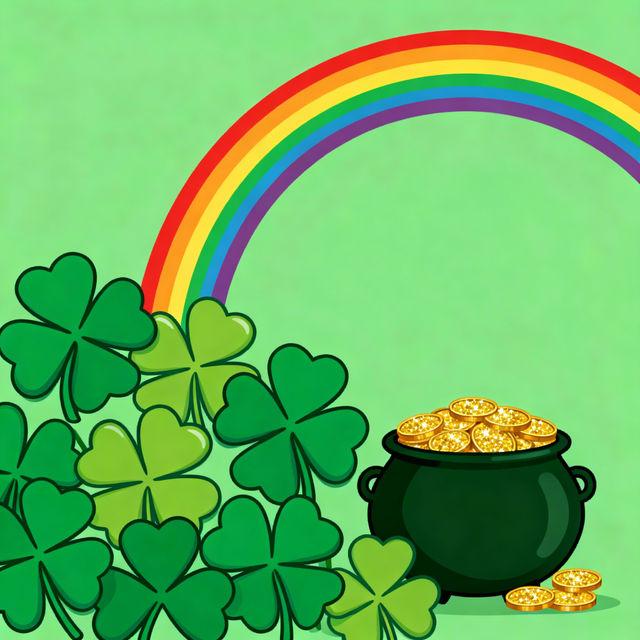
St. Patrick's Day Clip Art
Explore a vibrant collection of St. Patrick's Day clip art, perfect for invitations, decorations, and social media. Create your own unique designs with AI.

Tree Branches Drawings - AI Generated Art
Explore a stunning collection of AI-generated tree branches drawings. Find inspiration for your next artistic project or simply admire the intricate beauty of nature rendered by AI.

Easy Human Drawing
Explore a gallery of easy human drawings created by AI. Get inspired and learn how to draw people with simple, AI-generated examples. Perfect for beginners looking for easy human drawing.
Frequently Asked Questions
Your Questions About Data Art - AI Generated Visualizations Answered
What exactly is Data Art generated by AI?
Data Art generated by AI is a unique form of digital art where artificial intelligence algorithms interpret and transform raw data into visually compelling and aesthetically pleasing images. Instead of traditional artistic mediums, the 'input' is information, and the 'output' is a creative visualization that can reveal hidden patterns, trends, or simply offer a new perspective on the data's inherent beauty.
How does the AI turn data into art?
Our AI models analyze datasets, identifying relationships, structures, and characteristics. Based on this analysis, and guided by artistic principles and parameters, the AI generates visual representations. This can involve assigning colors to specific data points, mapping relationships with lines and shapes, or creating abstract forms that are inspired by the data's complexity and scale. The process is a fusion of analytical interpretation and creative synthesis.
Can I use these AI-generated data visualizations for my own projects?
Yes, these AI-generated data visualizations are designed to be versatile. You can use them to add a unique and sophisticated visual element to presentations, websites, reports, or any creative project. Their ability to communicate information visually makes them particularly effective for storytelling and enhancing understanding, while their artistic nature ensures they stand out.
What makes these AI data visualizations different from standard charts or graphs?
While standard charts and graphs focus primarily on clarity and precise data representation, AI-generated data art prioritizes aesthetic appeal and conceptual expression alongside informational content. These visualizations aim to evoke emotion, spark curiosity, and highlight the inherent beauty within data, often moving beyond literal interpretation to create unique artistic statements.