
Chart & Diagram Art Generator
Transform complex data into stunning visuals with our AI Chart & Diagram Art Generator. Effortlessly create unique chart art and compelling diagram visualizations with this intuitive AI tool.
No payment or credit card required.

As seen in


Transform Complex Data
Data Into Artistry
Elevate your reports and presentations by transforming raw data into captivating works of art. Our AI allows you to create charts with AI, turning mundane figures into engaging, artistic data visualizations that resonate with your audience and make information memorable.
Create Stunning Visualizations with AI
Step 1
Describe Your Visual
Begin by describing the chart or diagram you envision. Provide details about the type of data, the desired aesthetic (e.g., minimalist, futuristic, abstract), color palettes, and any specific elements you want to include. The more descriptive your prompt, the better the AI can translate your data into art.
Step 2
Generate Your Art
With your prompt ready, click the 'Generate Art' button. The AI will process your description and data inputs to create a unique visual representation. Watch as your data transforms into an artistic chart or diagram.
Step 3
Download and Share
Once your visual is created, you can download it in various formats suitable for reports, presentations, or web use. Share your compelling data visualizations with colleagues or your audience to make information more engaging and memorable.
Visualize Your Insights
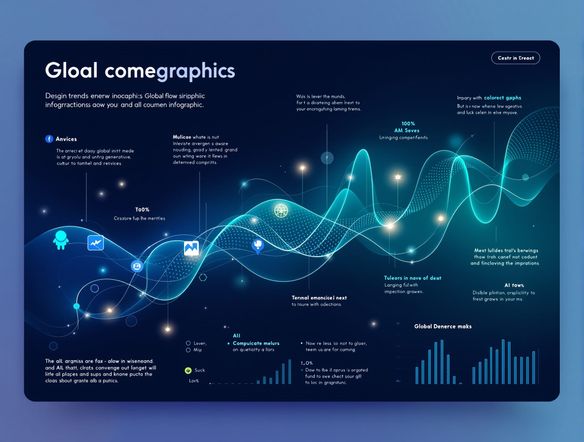
Intuitive Infographic Creation
Unlock the power of visual storytelling with our advanced AI graph generator. Effortlessly design stunning infographics that simplify complex information, making it accessible and engaging. Our tool empowers you with sophisticated infographic design AI capabilities, bringing your data to life.
Need inspiration?
Check out some of the top creations made by the NightCafe community.


Related Tools

Neon Cyber Noir Generator
Dive into the shadows with our Neon Cyber Noir AI generator. Craft striking cyberpunk noir visuals, perfect for artists and storytellers seeking atmospheric, futuristic art.
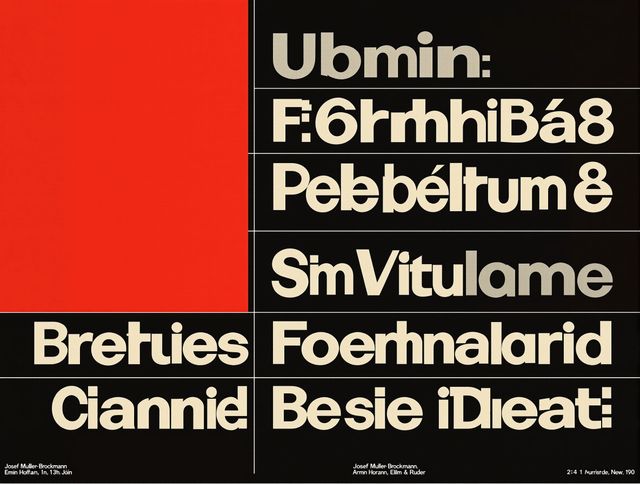
Swiss Style Graphic Generator
Effortlessly create striking Swiss Style graphic design with our AI generator. Ideal for posters, layouts, and branding, it's your go-to International Typographic Style generator.
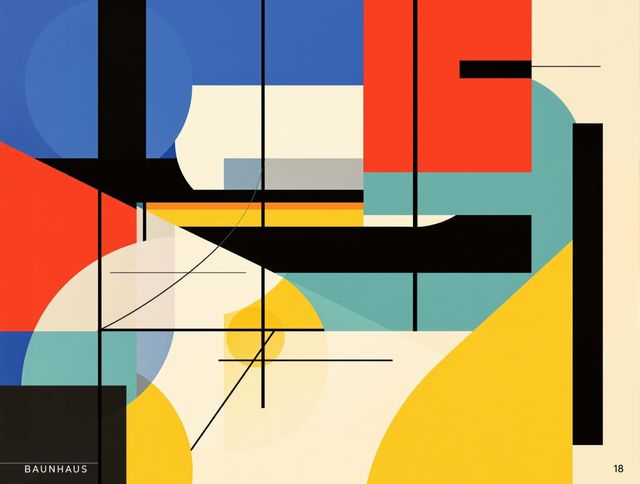
Bauhaus Poster Design Generator
Explore the iconic Bauhaus aesthetic with our AI Bauhaus design tool. Effortlessly generate unique Bauhaus posters, combining geometric shapes and bold colors for striking visual impact.

Holographic Gloss Finish Generator
Instantly apply a stunning holographic gloss finish to your designs. Our AI-powered holographic effect generator creates vibrant, eye-catching visuals with a professional glossy finish.
Frequently Asked Questions
Frequently Asked Questions About the AI Chart & Diagram Art Generator
How do I input my data for the AI Chart & Diagram Art Generator?
You can input your data by providing descriptive text prompts. Focus on clearly stating the type of chart or diagram you need (e.g., bar chart, flow chart, pie chart) and the key relationships or information you want to convey. The AI will interpret your text to generate the visual representation.
What types of charts and diagrams can I create with this tool?
This AI tool is designed to generate a wide variety of chart and diagram art, including but not limited to bar charts, pie charts, line graphs, flowcharts, organizational charts, and mind maps. You can also explore more abstract data visualizations that go beyond traditional formats.
Can I customize the artistic style of my charts and diagrams?
Yes, you can influence the artistic style of your generated charts and diagrams. By including style descriptors in your prompts, such as 'minimalist,' 'abstract,' 'watercolor,' or 'futuristic,' you can guide the AI to create visuals that match your aesthetic preferences and presentation needs.
How does this tool help make complex data more accessible?
The AI Chart & Diagram Art Generator transforms raw data into visually appealing and easy-to-understand artistic representations. By creating engaging infographics and unique chart art, it simplifies complex information, making it more memorable and impactful for your audience during reports and presentations.